Model & Calibration

Model Calibration
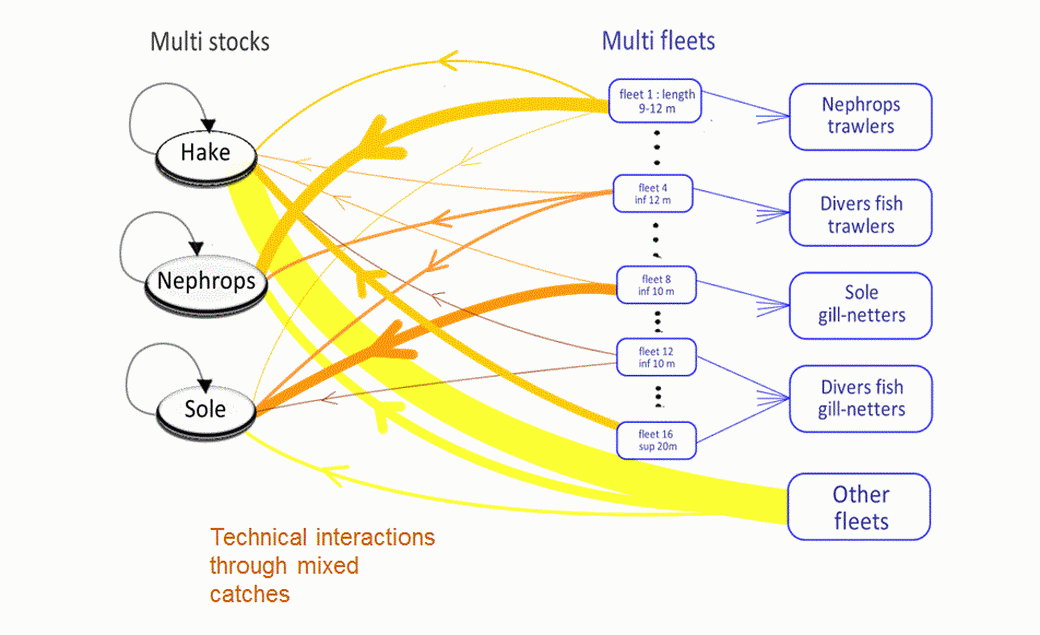
- 3 main species: Nephrops, Hake, Sole
- 17 fleets
- 2008 DATA
The Bio economic model is a multi-species, multi-fleets and age structured framework.
Consider the fish population dynamics:
where N stands for the abundance of species s=1,..,3 at age a=1,...,As.
M and F stand for natural and total fishing mortality rates
Catches and fishing mortality:
catches depend on initial fishing mortality, efforts multipliers u of sub-fleet f and abundance:
Profits:
The economic viability per sub-fleet is determined by their economic profitability, that is the difference between their gross income and their costs. The profit πf of a sub-fleet f is estimated as follows:
where :
αf corresponds to the income per unit of effort of sub-fleet f derived from catches of species not explicitly modelled
τf is the landing cost by sub-fleet as a proportion of the gross income
Vfuel corresponds to the volume of fuel used by fishing effort unit for one vessel of sub-fleet f and pfuel(t) is the fuel price by litre of the year t .
The cost variables Cvarf includes oil, supplies, ice, bait, gear and equipment costs while Cfixf corresponds to the annual costs including maintenance, repair, management and crew costs, fishing firms, licenses, insurance premiums and producer organisation charges.
Calibration:
reference year is 2008
Parameters vallues are derived fromICES databases, Ifremer SIH, DPMA databases and report of the working group on the assessment of southernsheelf stocks of hakes.
