The Status Quo Scenario: not economically viable
The status quo (SQ) strategy simulates continued fishing mortalities at levels observed in the 2008 baseline year.

this strategy is almost ecologically viable in the sense that the population viability probability is close to one (98,5%), the ecologial risk is low.

Trajectories of the Spawning Stock Biomass SSBs(t) of each species s
The viability thresholds are in red , The set of possibilities that includes all of the simulated trajectories is represented by the dark dotted lines and the grey field includes 95% of the trajectories. The green line is one particular trajectory among the 1000 trajectories associated to the same set of recruitments ω (.) and prices . The lines in blue represent the historical SSB for each species
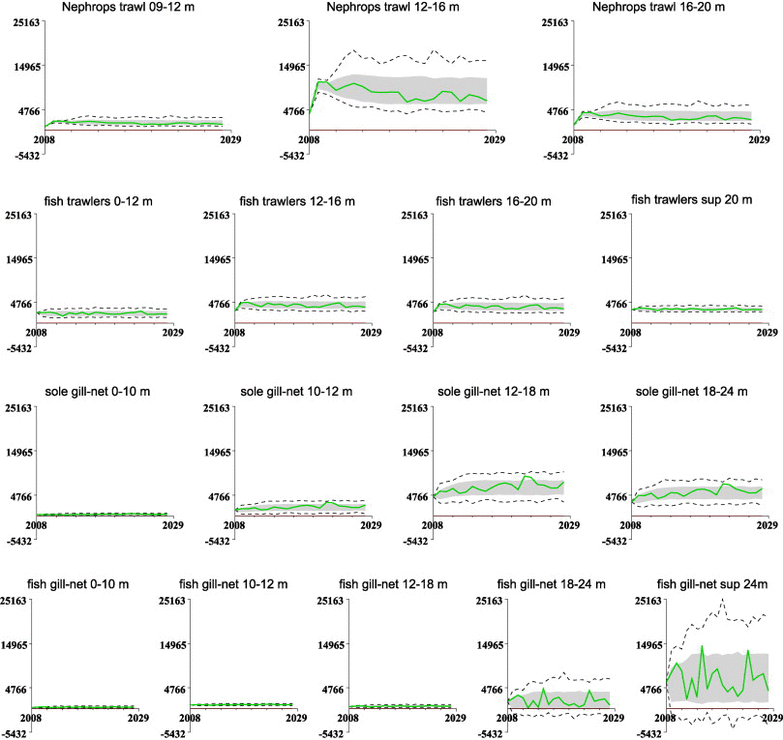
5The economic viability appears threatened under this strategy, the economic viability probability varies from 0% to 31,5% under different fuel prices scenarios.

Trajectories of the profits of each sub-fleet according to time t under a base case fuel scenario BC with a status quo strategy .
The viability thresholds are in red . The set of possibilities that includes all of the simulated trajectories is represented by the dark dotted line and the grey field includes 95% of the trajectories. The green line is one particular trajectory among the 1000 trajectories associated to the same set of recruitments ω (.) and prices


